Unlike traditional UTM’s data presentation, the NG-UTM’s Dashboard (Threat Intelligence Dashboard Center) provides information on network traffic, content, and hacker attack-defense records in a graphical way. It facilitates drill-down analysis, making it easier for administrators to identify the root causes of issues.
Upon entering the Dashboard’s homepage, there are module switches at the top. Among them, “Functional Configuration” switches back to the traditional management interface.
The following functions can be operated:
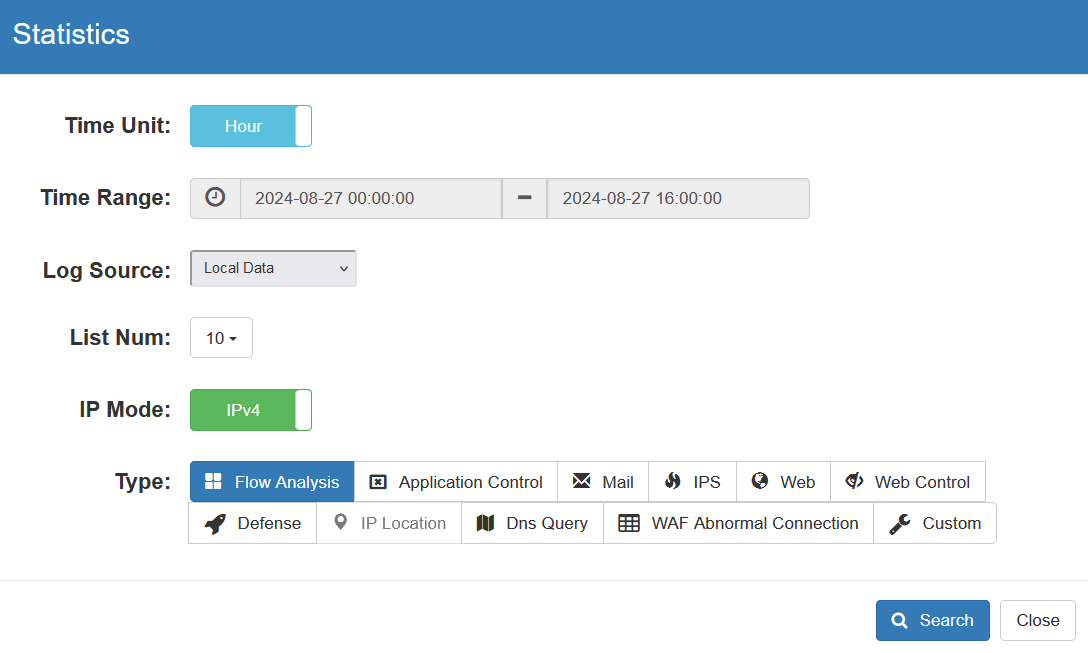
1. Time: Choose between the 24-hour mode or custom range.
2. Ranking: Set the statistical ranking quantity for each item. The default is 10, indicating the display of the top 10 data.
3. IPV4/IPV6: Switch between the current address.
4. PNG/PDF: Download the current displayed statistical data in the selected file format.
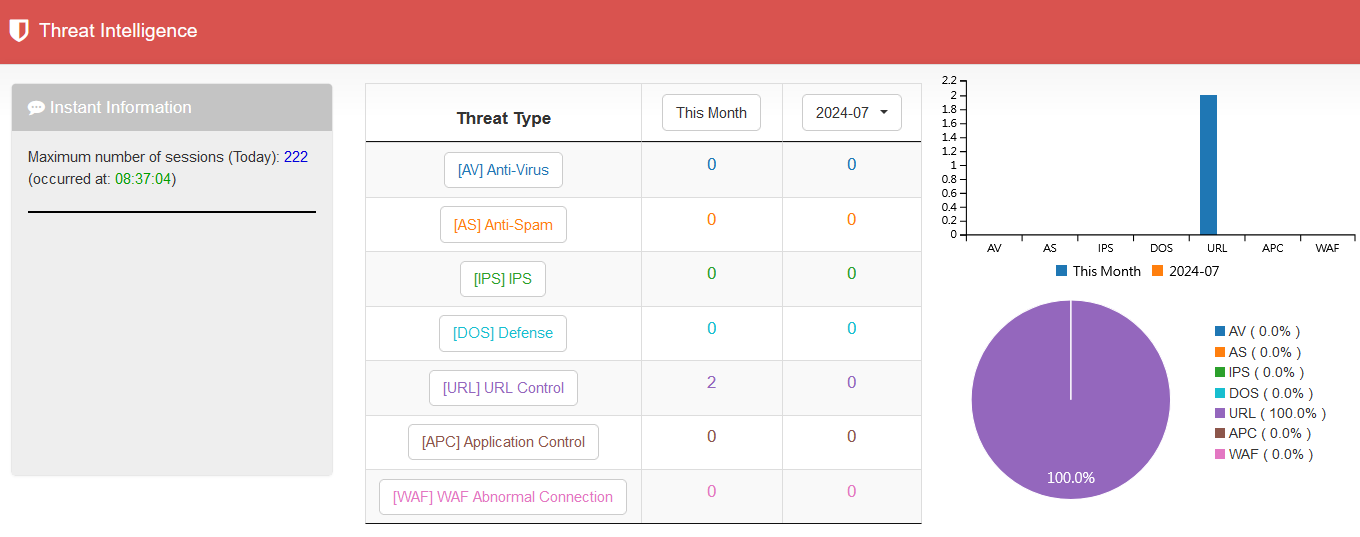
Display the attack-defense records of NG-UTM. The threat intelligence on the homepage is divided into real-time information and categorized attack-defense information by risk type. Real-time information shows today’s highest connections, suspicious connections, etc. The categorized attack-defense information can list virus protection, spam emails, IPS, firewall protection, and various controls according to today or this month, with a simple comparison with the last five months’ data.
The threat intelligence on the homepage is a summary of statistics. For more detailed information, clicking the threat intelligence icon above will open a new window displaying more complete information, including area charts, pie charts, and ranking lists of various risk types.
NG-UTM is based on Deep Packet Inspection (DPI). Every network connection of each inbound and outbound device is identified for its used application and its usage statistic.
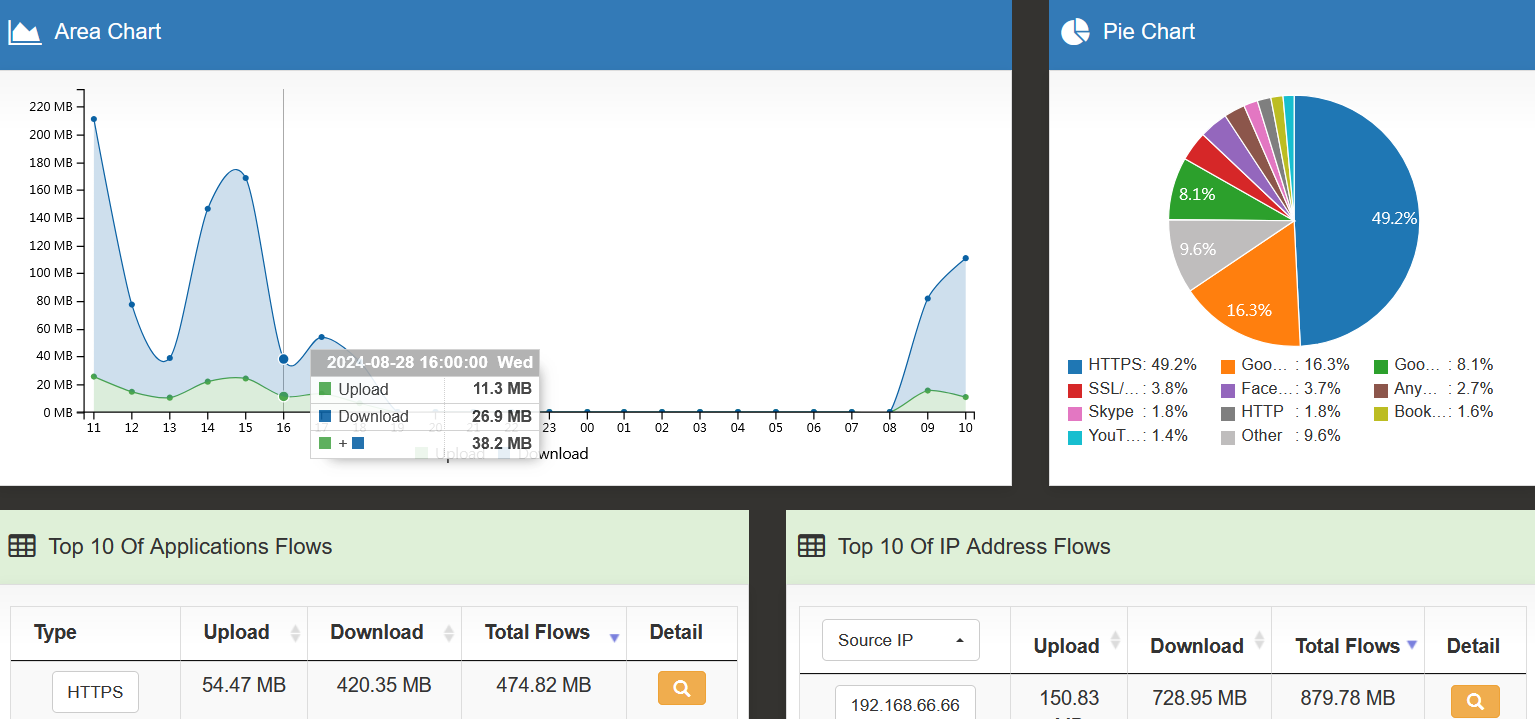
The traffic analysis (Application) on the Dashboard presents these statistical data in a graphical interface.
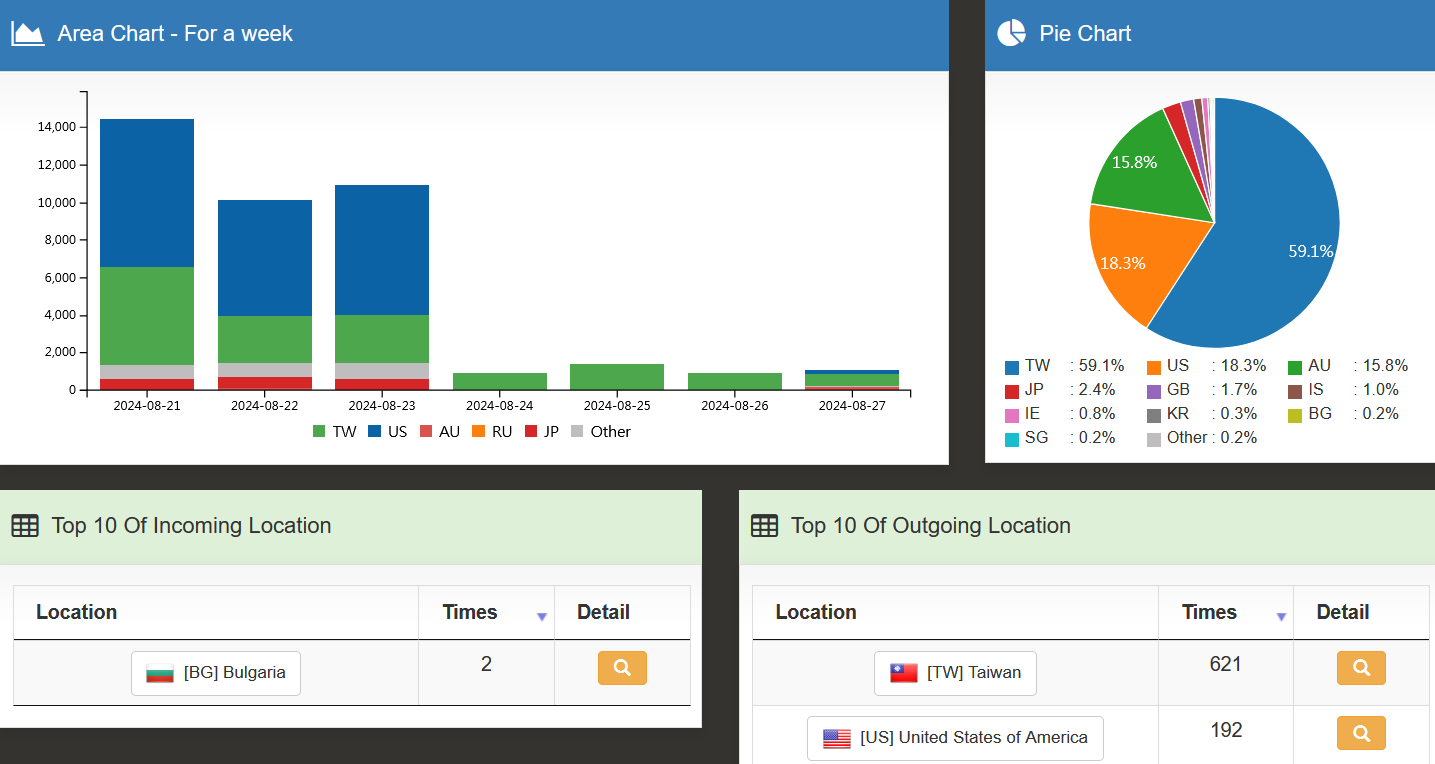
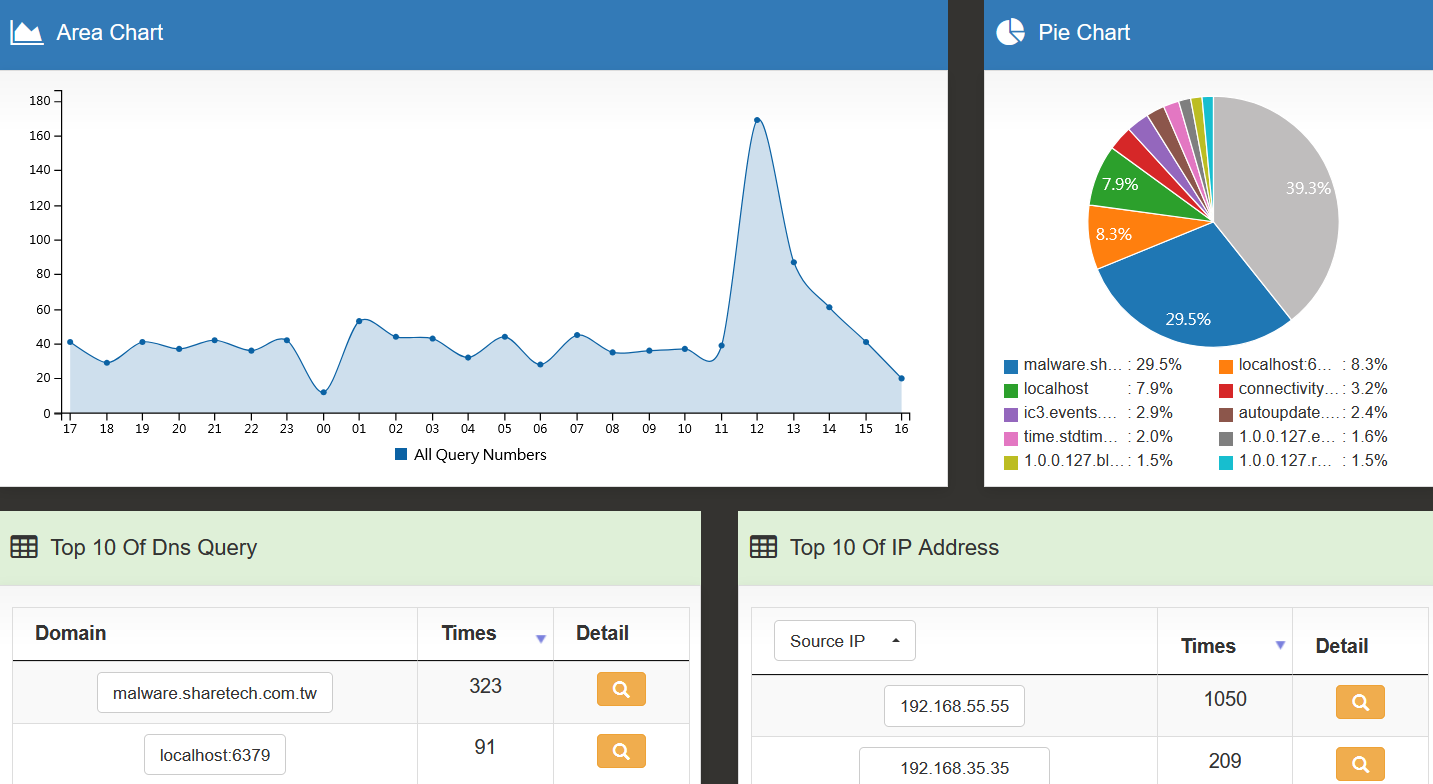
Area Chart: Summarize the total upload/download traffic passing through NG-UTM in the past 24 hours, with each hour as the basic unit. After clicking on the statistical number of each hour, the Dashboard will list the usage distribution of all applications during that hour.
Pie Chart: Show the distribution ratio of each application.
Top 10 Application Traffic: List the top 10 applications with the most usage in the past 24 hours. Clicking on the type of application will automatically analyze its distribution in the past 24 hours on the area chart.
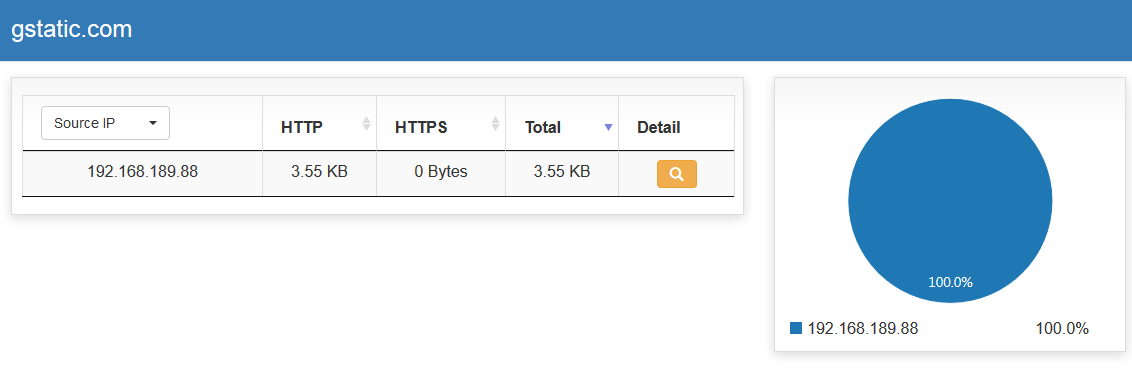
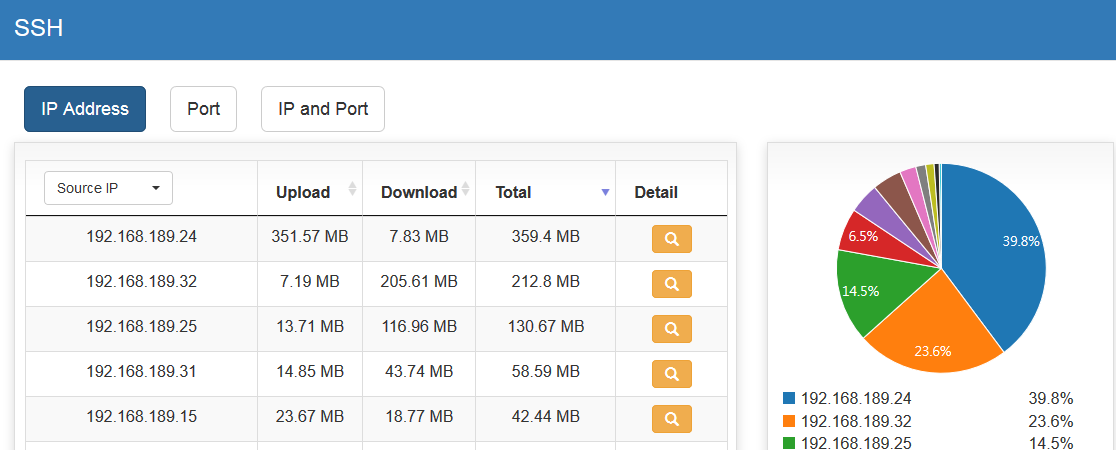
Clicking on the detailed field icon of each application will display more detailed statistical analysis. Taking HTTPS as an example:
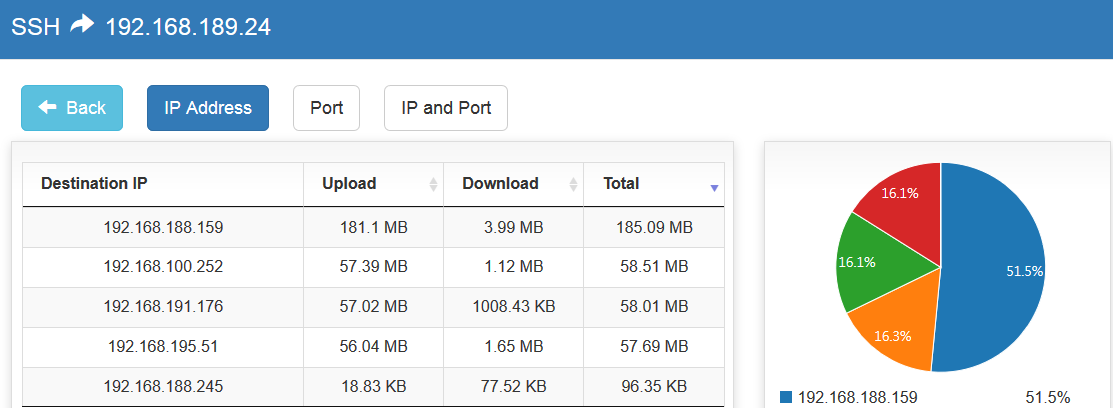
Clicking on each IP address’s detailed field icon will display where this source IP address used HTTPS and the usage amounts.
Figure 16-5 Application Source/Destination IP Address Usage Analysis
Top 10 IP Address Traffic: List the top 10 source or destination IP addresses with the largest usage in the past 24 hours. After clicking on the IP address, the system will automatically analyze its distribution in the past 24 hours on the area chart, like the query method based on applications, but this is based on source/destination IP addresses.
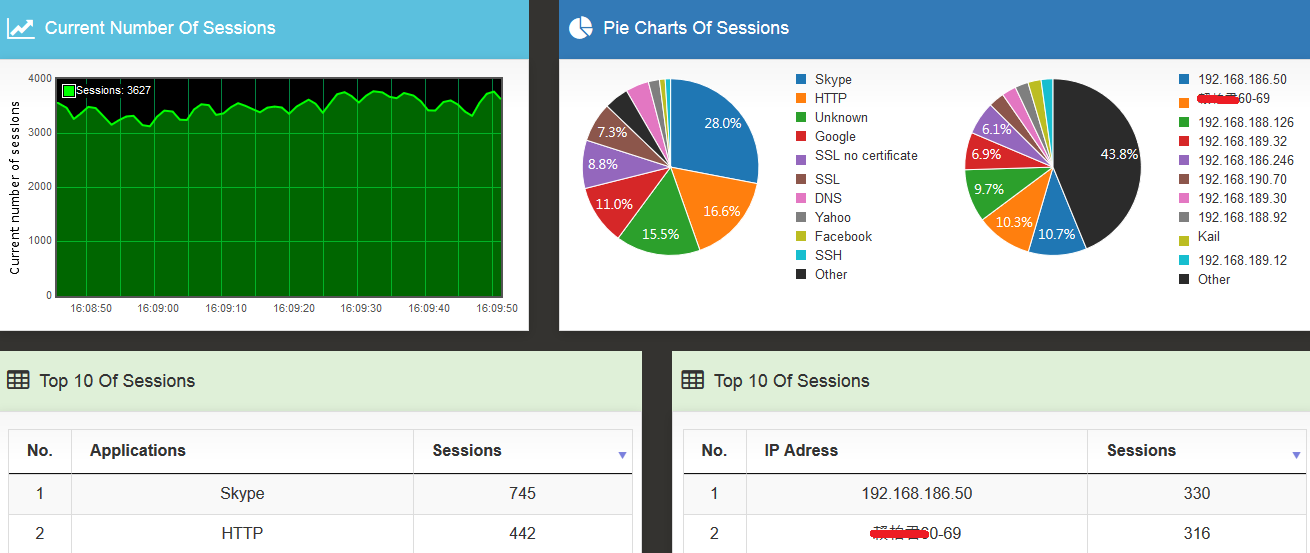
NG-UTM allows viewing real-time connections for all traffic, classifying each application, and statistically analyzing real-time connection numbers for each source IP address. This feature makes it easier to identify users with abnormal connections.
In the dynamically displayed graph, by default, the system calculates the proportion after summarizing all quantities. If administrators want to exclude certain data from the total statistical count, they can simply click on the item next to the pie chart, and NG-UTM will automatically exclude its data and recompute the distribution.
To view the statistics of firewall protection, the following actions need to be confirmed in advance:
1. “Other” items in “Object > Firewall Protection” must be checked.
2. The system defaults to statistical analysis of hacker attack-defense records for the local machine. When administrators use the Policy interface for user access to the network, and one of the regulations applies firewall protection settings, the Dashboard will also count these records.
After meeting above 2 conditions, NG-UTM will automatically perform statistical analysis.
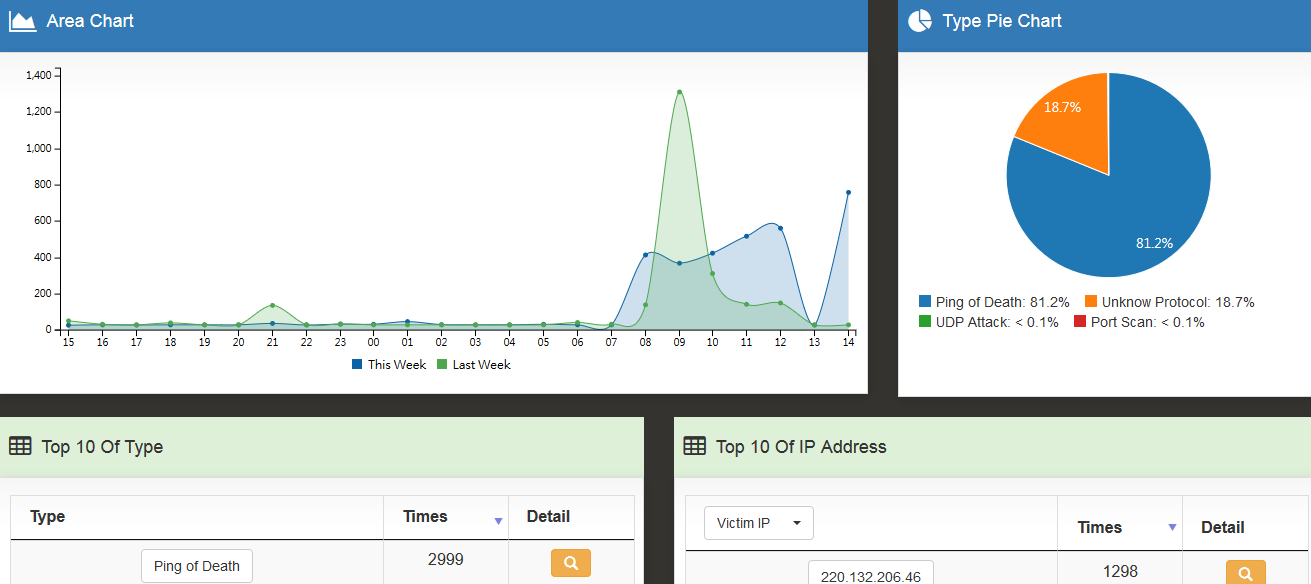
Pie Chart: Classify by attack type and display the distribution ratio.
Top 10: There are 2 categories: attack types and attacking/attacked IP addresses. Clicking on the detailed field icon allows for further drill-down into more detailed information.
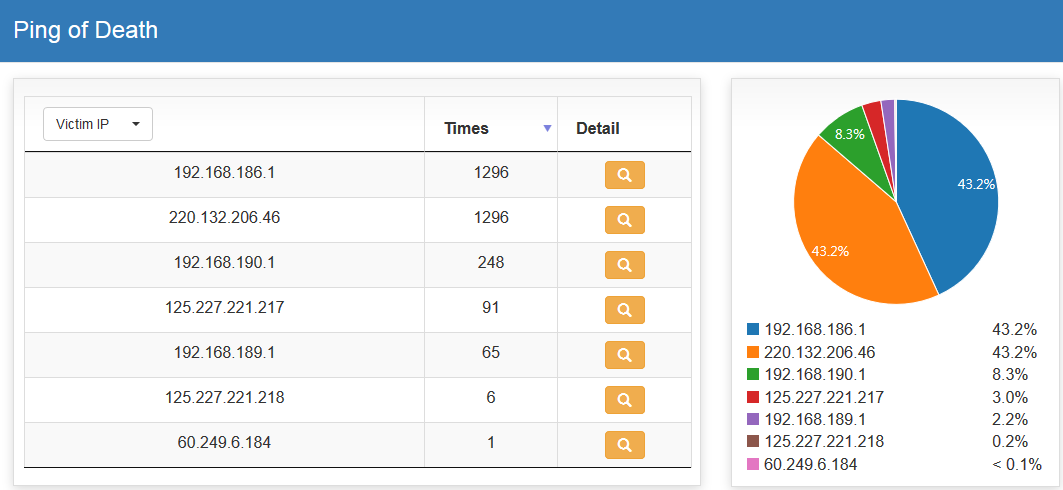
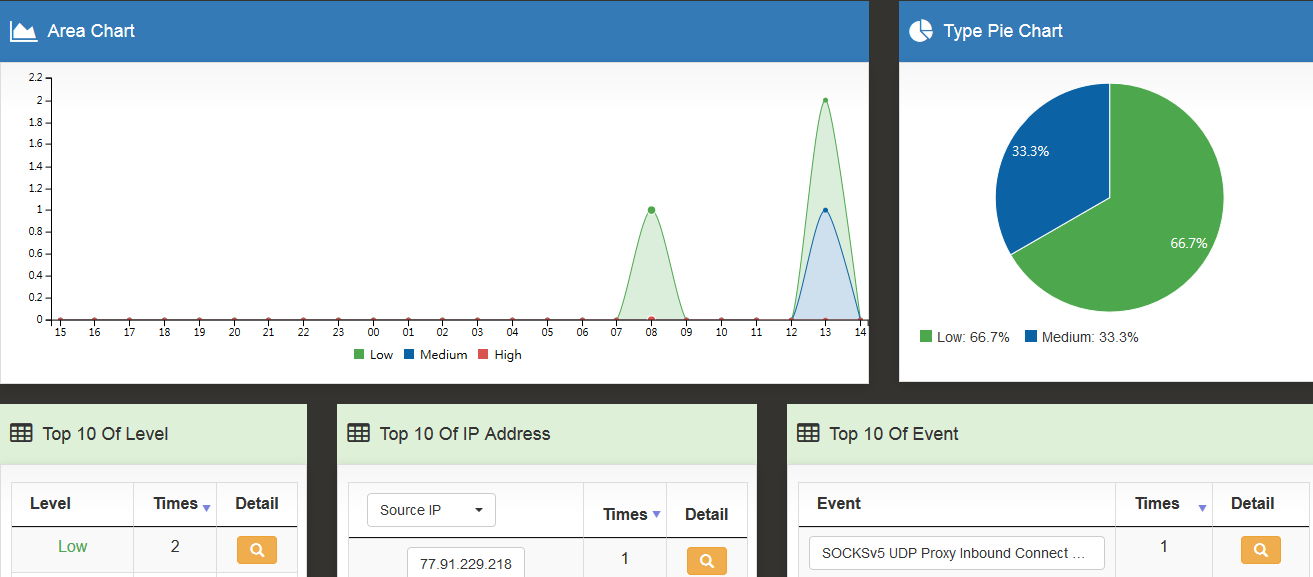
Pie Chart: Classify by severity level of characteristics into high, medium, and low, and display in the distribution ratio.
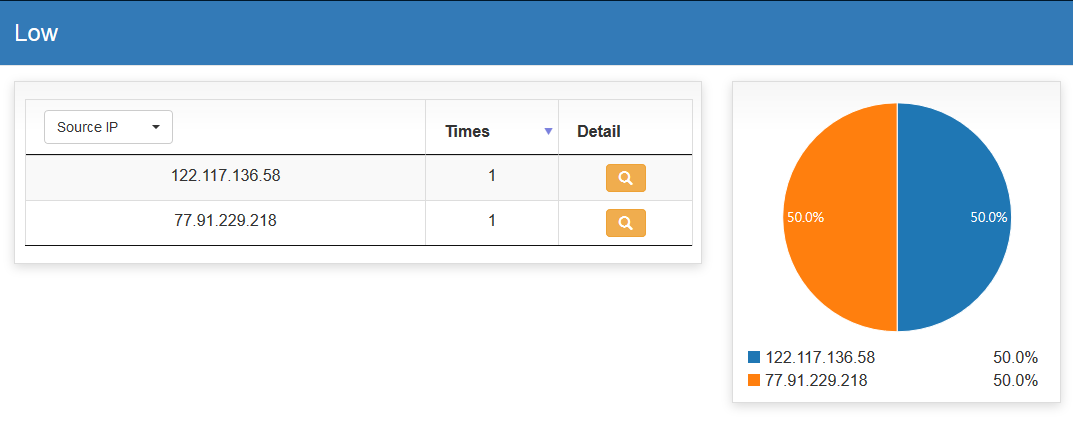
Top 10: There are 3 categories: severity level, attack or victim IP addresses, and attack types. Clicking on the detailed field allows for further drill-down into more detailed information.
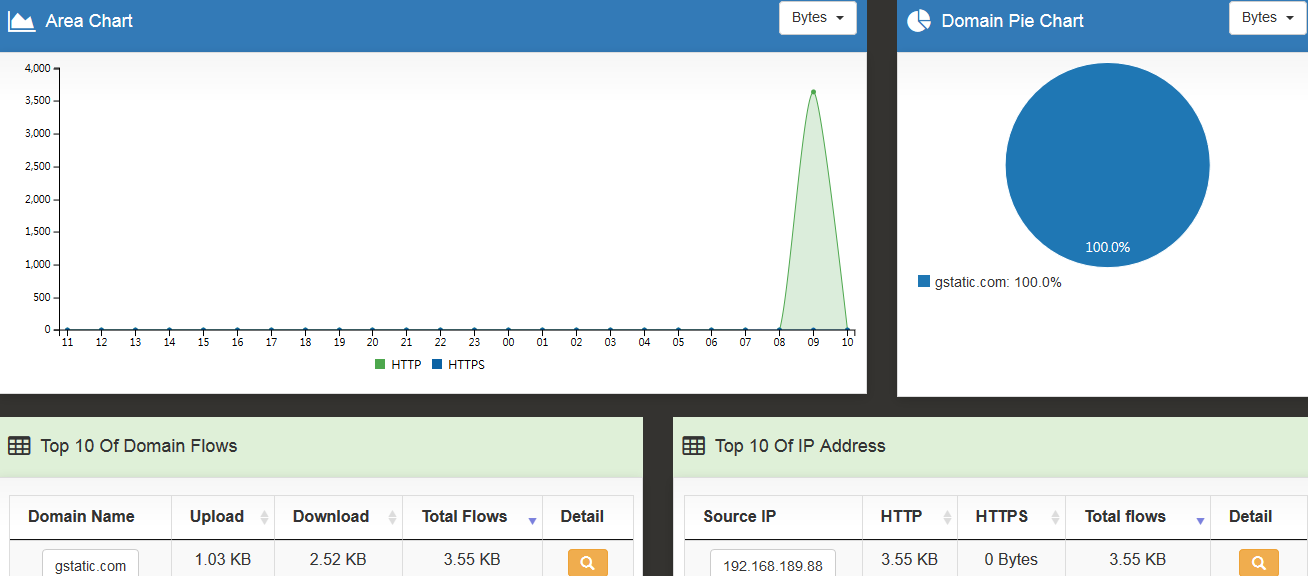
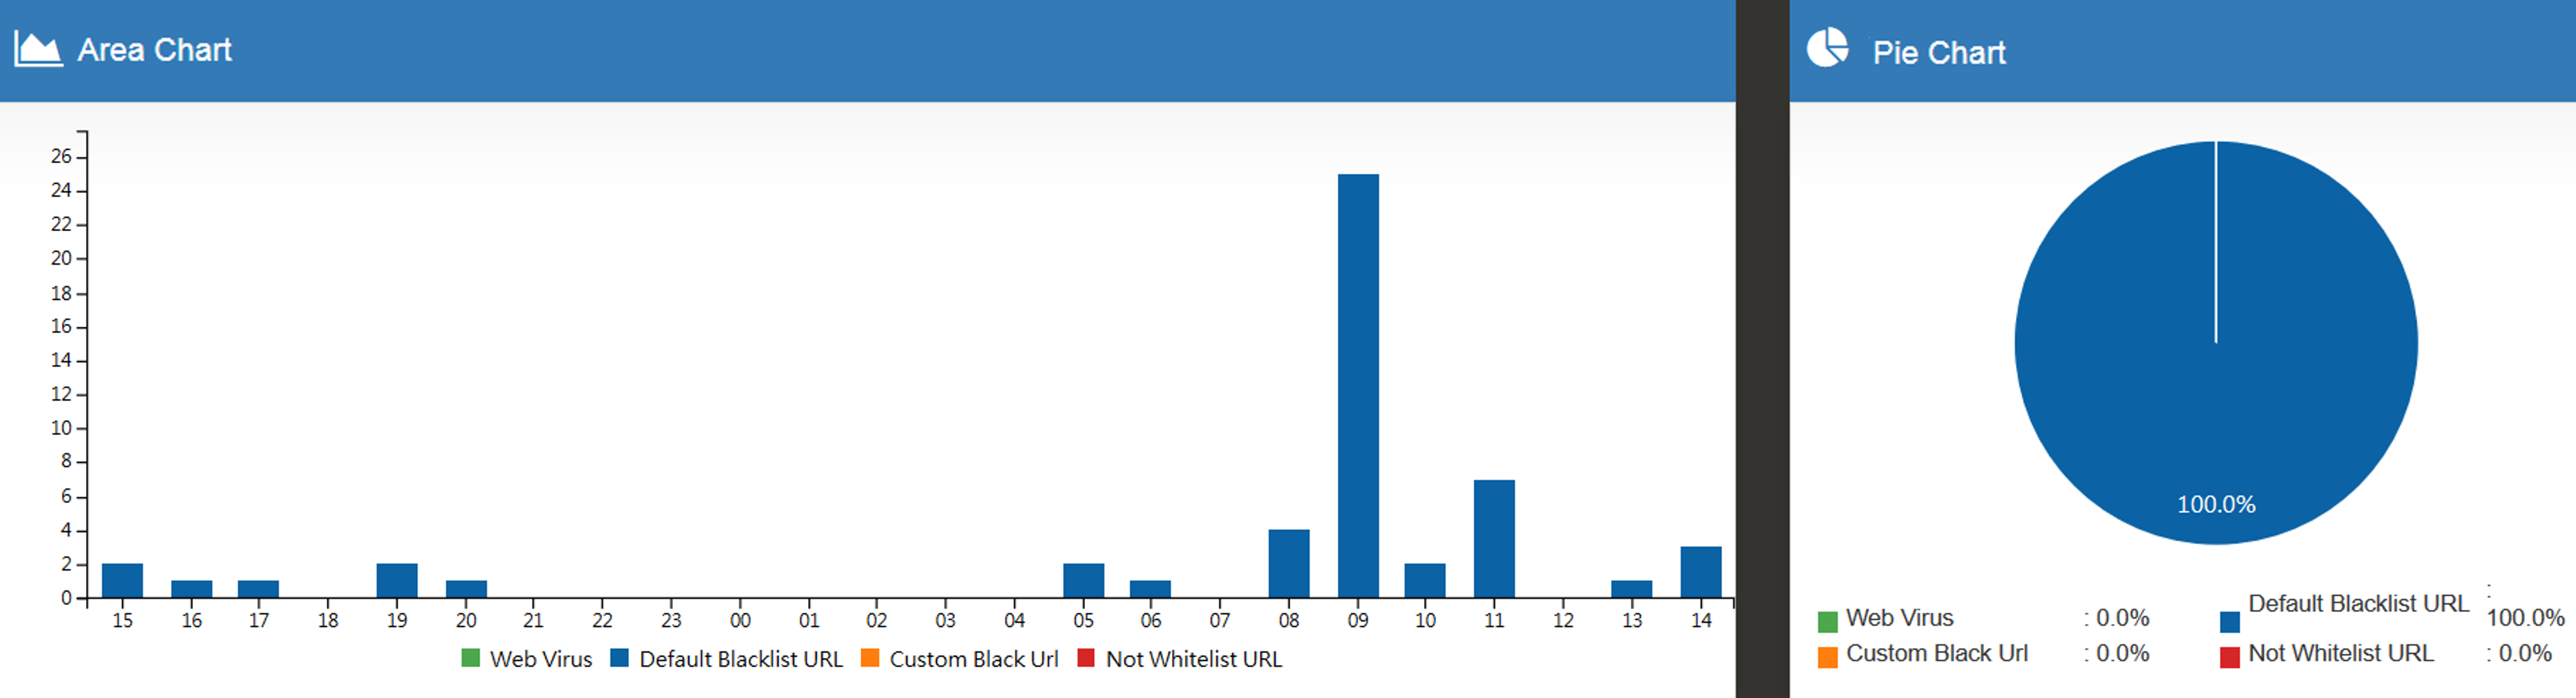
Pie Chart: Classify by Web (including HTTP and HTTPS sums) website categories, and display the distribution ratio.
Top 10: There are 2 categories: top 10 visited websites and top 10 WEB usage. Clicking on allows for further drill-down into more detailed information.
To view MAIL statistics, several steps need to be confirmed beforehand:
1. “Mail Security > Anti-Spam > Action for Spam Mail” must have one option enabled. If administrators prefer not to change the existing mechanism but only want to analyze it, they can select “Data analysis only.”
2. In the Policy interface for user access to the network, there must be one regulation with SMTP logging enabled.
After meeting the above 2 conditions, NG-UTM will automatically perform statistical analysis.
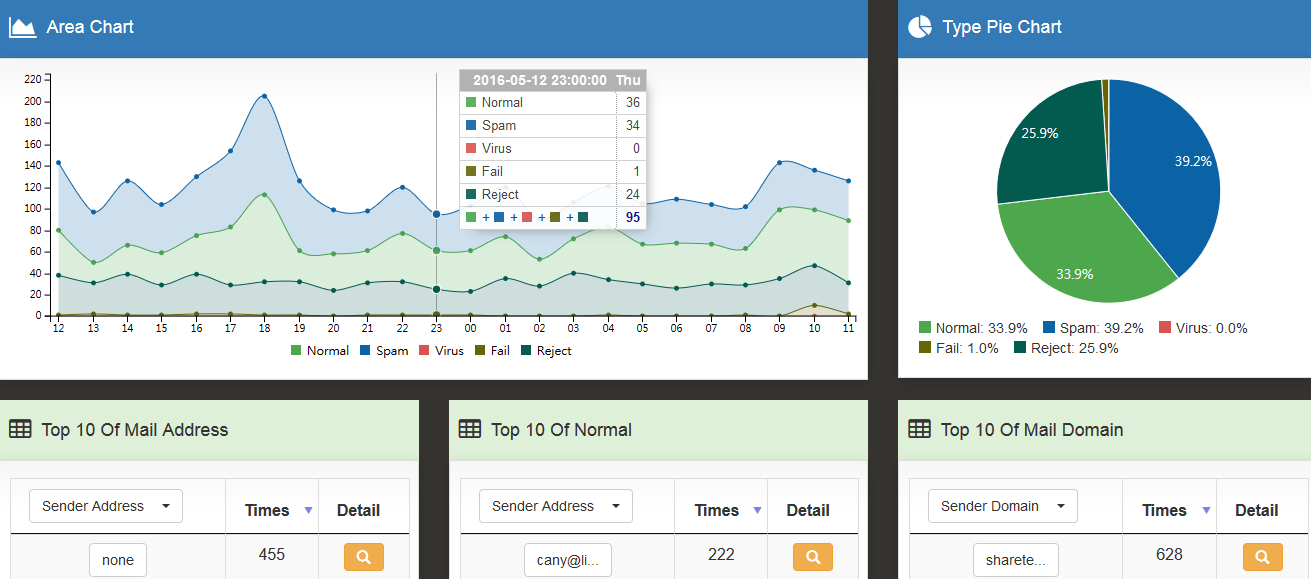
Area Chart: Summarize all mail traffic entering and leaving NG-UTM over the past 24 hours, displaying statistics for normal mail, spam, virus-infected mail, failed connections, and rejected connections. Clicking on each hourly statistic will display the distribution of mail usage for that hour. Further clicking on each mail item allows for detailed usage tracking.
Pie Chart: Statistical analysis of five types of mail: normal, spam, virus-infected, failed connections, and rejected connections.
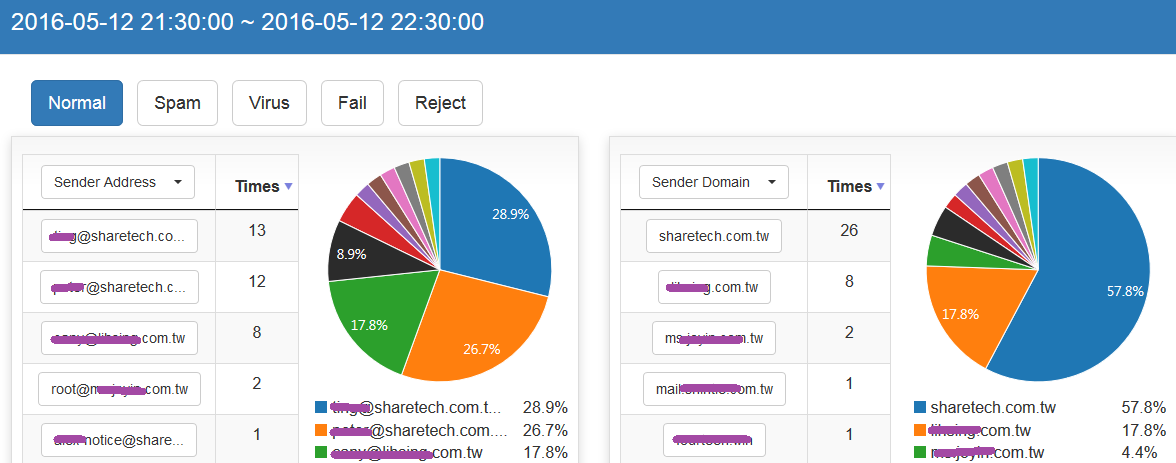
Top 10: There are 7 types of Top 10 statistical analyses. Clicking on allows for further drill-down into more detailed information. The example below presents information about sender Peter@sharetech.com.tw sending to hotmail.com to the account sharetech-peter@hotmail.com, including sending time, subject, size, etc.
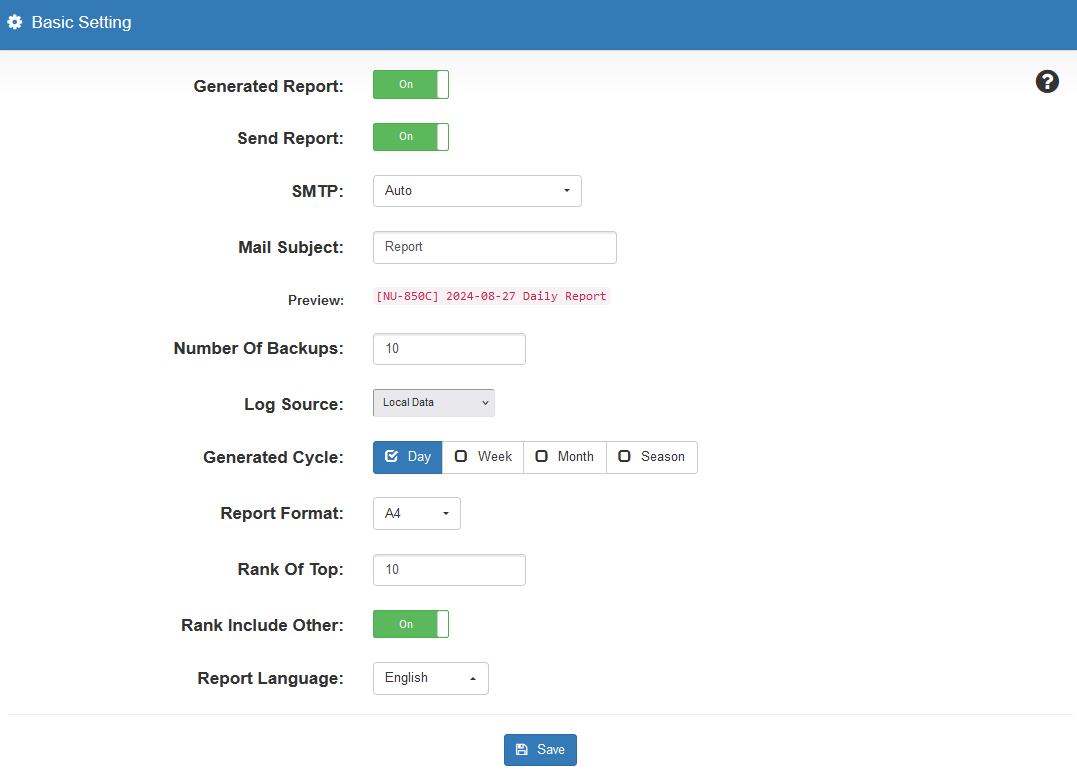
Generate reports from statistical information and set to send to specified administrators. After setting the SMTP server in 2-6. Notification, you can choose which account to receive the report here.


 allows for further drill-down into more detailed information.